Tuesday, October 11, 2011
SQL Server Agent Job
Note that this tutorial was written for those using the 2000 edition of SQL Server (SQL Server 2000). For later versions of SQL Server, check out the SQL Server 2008 tutorial.
The SQL Server Agent is a service that lets you configure scheduled tasks and system alerts. SQL Server Agent runs continuously in the background as a Windows Service.The SQL Server Agent is made up of the following components:
| Component | Description |
| Jobs | SQL jobs consist of one or more steps to be executed. Each step consists of a SQL statement. SQL Agent Jobs can be scheduled to run at specified times or at specified intervals. |
| Alerts | SQL Alerts consist of a set of actions to occur when a specific event occurs (such as when a particular error occurs, or the database reaches a defined size). Alerts can include sending an email to the administrator, paging the administrator, or running a job to fix the problem. |
| Operators | Operators are people who can address problems with SQL Server. Operators can be identified through their network account or their email identifier. These are usually the people who alerts are sent to. |
SQL Agent Configuration
Behind the scenes, SQL Agent Job definitions are specified in the msdb database. You might remember the msdb database from a previous lesson. It is a system database that is created when you first install SQL Server.You don't really need to know that in order to use the SQL Agent Service though. You can configure SQL Server Agent jobs, alerts and operators via Enterprise Manager. Applications that use SQL-DMO or Transact-SQL with a standard database API can also do this, but for now, we'll stick with Enterprise Manager.
Starting the SQL Server Agent
You can start and stop the SQL Server Agent Service via Enterprise Manager, the Windows Services console, or via the SQL Server Service Manager. More on the Service Manager later, but for now, you should know that you need to have the SQL Server Agent Service running before any scheduled jobs can be run or alerts can sent.To start the SQL Server Agent Service via Enterprise Manager, right click on the "SQL Service Agent" node, and click "Start":
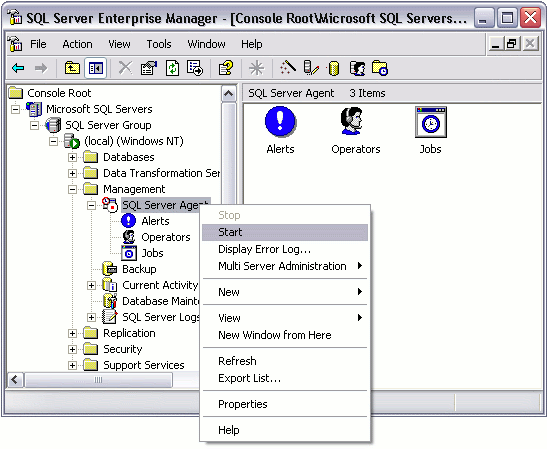 Now that SQL Server Agent is running, any jobs or alerts that you create will automatically run when they're supposed to...
Creating a SQL Server Agent Job
- From the "SQL Server Agent" node, right click on the "Jobs" node, and select "New Job":
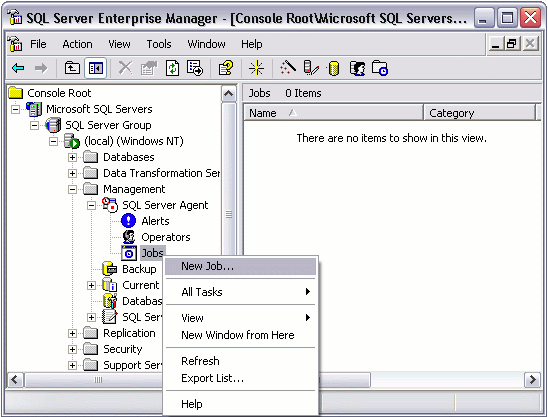
- Complete the details in the "General" tab:
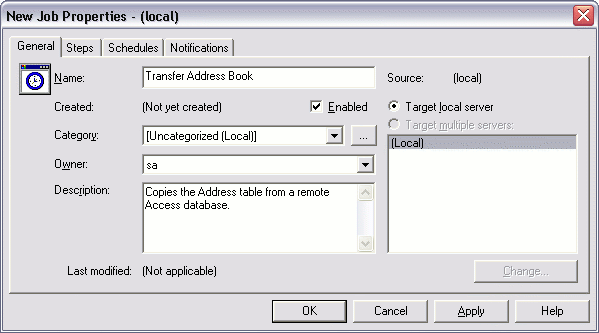
- Complete the details in the "General" tab:

- From the "Steps" tab, click "New"
- Complete the details for this step. In this example, we are using the dtsrun utility to execute a DTS package:
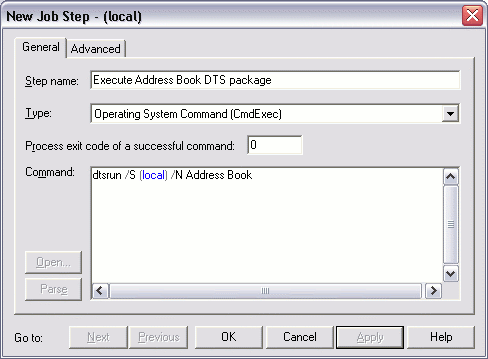
- From the "Schedules" tab, click "New Schedule"
- Give this schedule a name and specify the schedule type:
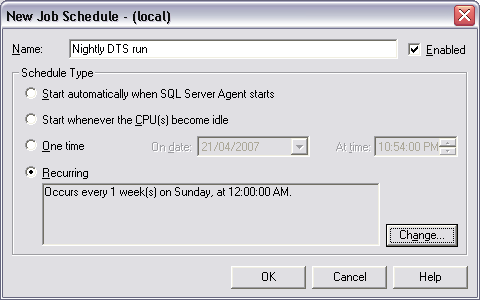
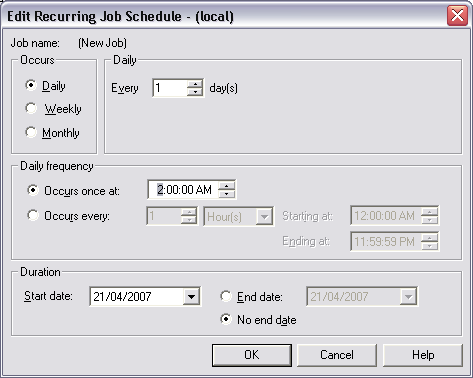
- If you need to set a recurring schedule, click "Change" (from the previous screen) and complete the details:
Modifying your SQL Agent Job
You can view your SQL Agent Job under the "Jobs" node. If you need to modify your SQL Agent Job, you can do so by right clicking on the job, then selecting "Properties". You can also run your job (by selecting "Start Job"), view its history, disable it, and more.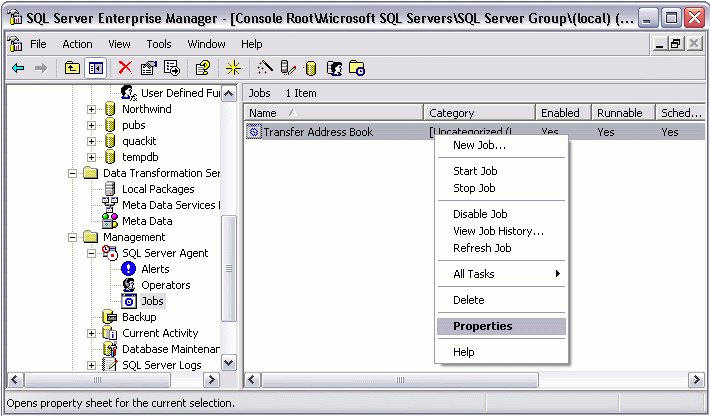
Is the SQL Server Agent Running?
By looking at the screen shot above, I can tell that the SQL Server Agent Service is not running. The icon is what gives it away. Here's what the icon should look like:| Running | |
| Not Running |
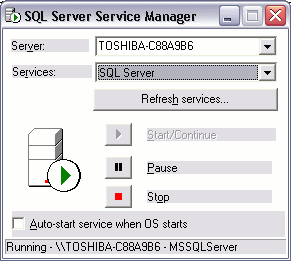
SQL Server Service Manager is used to start, stop, and pause the various components on SQL Server. These components run as Windows services.
The following services can be stopped/started/paused via the SQL Service Manager:
| Service | Description |
|---|---|
| SQL Server service | Implements the SQL Server database engine. There is one SQL Server service for each instance of SQL Server running on the computer. |
| SQL Server Agent service | Implements the agent that runs SQL Agent jobs and alerts. There's one SQL Agent service for each instance of SQL Server running on the computer. |
| Microsoft Search service | Implements the full-text search engine. There is only one full-text search engine regardless of how many instances of SQL Server are running on the computer. |
| MSDTC service | Manages distributed transactions. There is only one MSDTC service regardless of how many instances of SQL Server are running on the computer. |
| MSSQLServerOlAPService service | Implements the SQL Server Analysis Services. There is only one MSSQLServerOlAPService service regardless of how many instances of SQL Server are running on the computer. |
Using the SQL Server Service Manager
SQL Server Service Manager is a taskbar application. When SQL Server Service Manager is minimized, an iconTo use the Service Manager, you can either right click on the icon, or double click on the icon. Right clicking provides a menu of options, double clicking maximizes the Service Manager for you to select your options.
SQL Profiler is a handy tool that enables you to monitor events within your SQL Server (or more specifically, a SQL Server instance). For example, you could use SQL Profiler to check the performance of a stored procedure. You could also use SQL Profiler to troubleshoot a problem that's occuring in your production environment.
When using SQL Profiler, you can save the output to a "trace file" so that you can later analyze the events that occured during your trace.
Accessing SQL Profiler
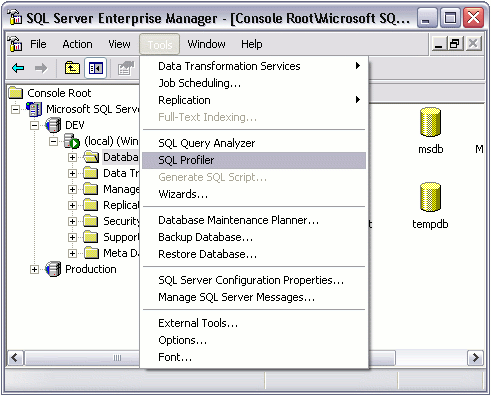
To access SQL Profiler:- Open Enterprise Manager
- Select Tools > SQL Profiler menu
Creating & Running A "Trace"
To monitor activity with SQL Profiler, you create a "trace". A trace captures data based on activity at the time it is run.To create a trace:
- Open SQL Profiler as demonstrated above
- Select File > New > Trace...
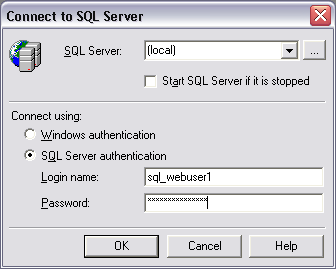
- Select the SQL Server you'd like to connect to, provide authentication details, then click OK
- In Trace Name field, enter a name for the trace, then set the other trace properties as required. For now, just use the default settings
- When you're ready to run the trace, click "Run". You will see something like this:
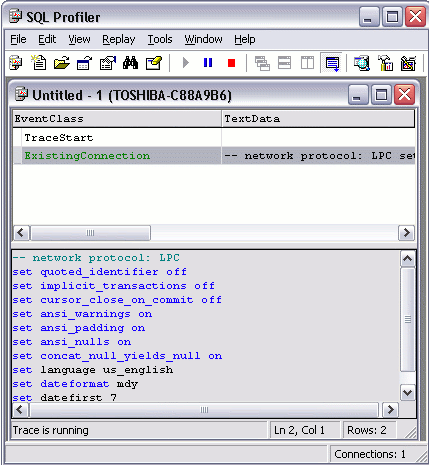
- When you're ready to stop the trace, click the "stop trace" icon

Explanation of the "Trace Properties" Screen
In the previous steps, when we got to the "Trace Properties" screen (step 4), we used the default trace properties. You can change any of these properties as required. For example, you could save the trace output to a file or database table. You could also change the events, data columns, and/or filter the data presented in the trace.Following is a more detailed explanation of each tab on the Trace Properties screen.
The "General" Tab
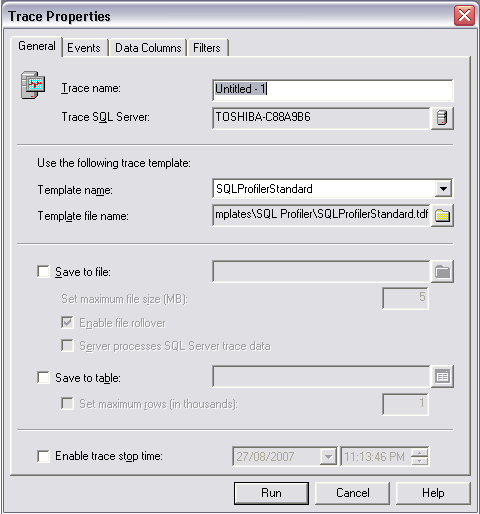 The following table provides an explanation of the options on the General tab.
| Field | Description |
|---|---|
| Trace name | Provides a name for the trace. |
| Trace SQL server | This is the server you'd like to run the trace against. |
| Template name | This allows you to select a template to base the trace on. Templates provide you with a trace where the options from the Events, Data Columns, and Filters tabs are pre-configured. SQL Server includes a number of templates that you can use. SQLProfilerStandard is the default. The template you select will depend on the data you need from your trace. You can also create your own templates if required. |
| Trace file name | Allows you to provide the full path to a template. |
| Save to file | Allows you to save the trace output to a file. |
| Save to table | Allows you to save the trace output to a database table. |
| Enable trace stop time | Allows you to specify a date and time for the trace to stop. |
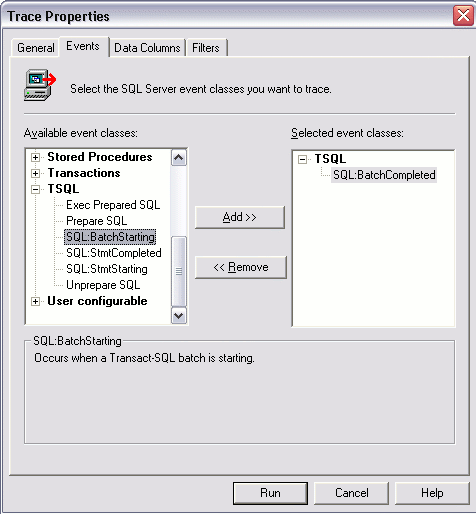
The "Events" Tab
The Events tab consists of event classes grouped by event categories. An event class is the column that describes the event produced by SQL Server. An event is an action generated within the SQL Server engine. Some examples of events include:- Transact-SQL SELECT, INSERT, UPDATE, and DELETE statements
- Locks being acquired/released
- Stored procedures being started/stopped
- A login connection/failure/disconnection
- A cursor being opened
- Errors written to the event log
- A remote procedure call (RPC) batch status
- Security permission checks
The "Data Columns" Tab
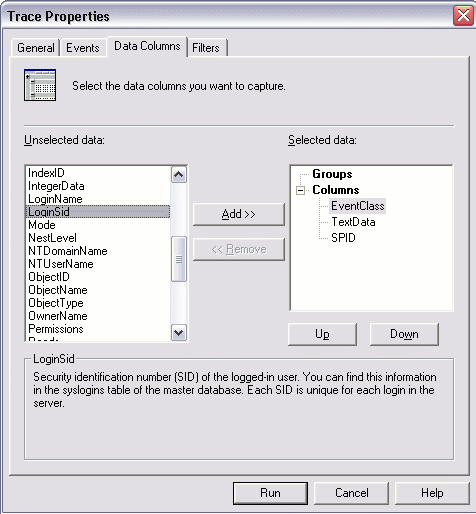
Data columns describe the data collected for each event class included in the trace. When you view the results of a trace, the data is presented within these data columns.Note that the data columns that are available will depend on the event classes selected. This is because the event class determines the type of data available.
Also note that default data columns are selected automatically with all event classes.
The "Filters" Tab
Filters allow you to filter the data collected by the event. This can help you eliminate data you're not interested in, so that you can concentrate on the data you are interested in. For example, if you're only interested in activity from one user, you can filter the trace to only that user.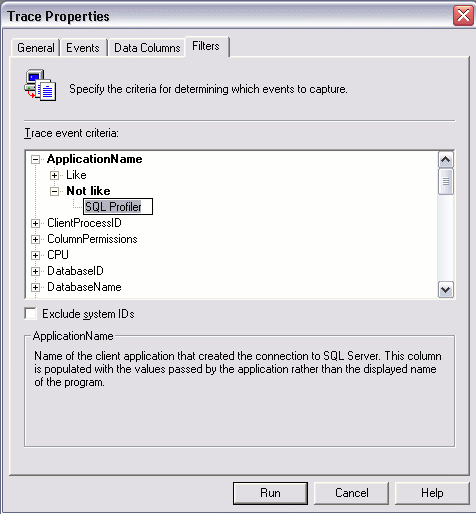
SQL Server Summary
Note that this tutorial was written for those using the 2000 edition of SQL Server (SQL Server 2000). For later versions of SQL Server, check out the SQL Server 2008 tutorial.
Congratulations for reaching the end of this SQL Server tutorial!SQL Server is a powerful application, and this tutorial has provided an overview of the main concepts involved in administering SQL Server.
To recap briefly, we've:
- created databases
- created database tables
- inserted data into those tables
- used the Query Analyzer to run a query
- created a login account
- created and executed a DTS package
- executed that same DTS package via a scheduled job
- and more
What Next?
The most logical next step from learning SQL Server is to learn SQL itself (if you haven't already done this that is). SQL stands for Structured Query Language and enables you to perform database related tasks programatically. Most of the tasks in this tutorial can be done programatically using SQL.Probably the most common use for SQL is to work with the data in the database. For example, to insert data, select data, update data, or to delete data. Any database driven website will have many SQL statements doing this stuff.
To learn more about SQL, check out the SQL tutorial.
